
 日本語
日本語Debugger won’t load (stalls) when trying to enter debug mode
Debugger won’t load (stalls) when trying to enter debug mode
Hi,
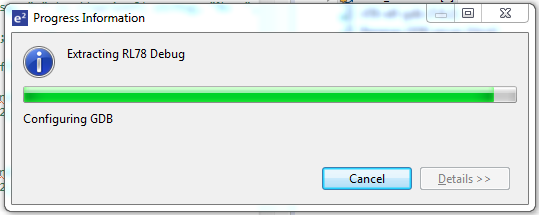
I’m currently trying to enter debug mode using the GCC for Renesas RL78 4.9.2.201803-GNURL78-ELF toolchain but the program has stalled at the “Configuring GDB” dialog (Extracting RL78 Debug).
The debugger works however if the KPIT GNURL78v15.02-ELF Toolchain is selected.
I select the GCC toolchain from the Toolchain tab of the Project->Properties->C/C++ Build window and then click “Apply and Close”… When I rebuild the project and try to debug, the dialog progresses close to the end and then stalls (image attached).
When I perform the same sequence with the KPIT toolchain, everything is fine…
I am developing for an RL78 device (R5F104PJ) using e2studio 7.2.0. My debugger is an E1.
Any ideas?
Thanks for your help,
Steve
Hello,
Unfortunately we could not reproduce stalling Extracting RL78 Debug with RL78 1803 toolchain.
We have tried with e2studio 7.0, 7.2 both simulator and a R5F104PJ dev board.
The extraction process in all cases and with multiple tries completed successfully each time.
We can think of these reasons causing problems on your machine:
1. the antivirus blocks gdb executable. You can monitor gdb connection and flashing progress in e2studio Console window, namely the Renesas GDB Server pane. This should give you a clue at which step it fails.
2. the debugger configuration is incorrect for the target device. Please check for your project the Debugger configuration. By right clicking on your project→Debug as→Debug configurations you can access the configuration for your current project. By switching to Debugger tab and selecting Connection Settings you can review your settings.
Please take a look at these settings as well as the console output in order to try to see at which stage does it fail. Deactivating antivirus temporarily is also worth a shot.
Regards,
– The GNU Tools Team
-
sdutempl -
Hi,
I probably had an incorrect configuration from an updated that was performed, migrating from e2Studio 6.0.0 to 7.2.0. I re-created a new project and things now seem to work (I haven’t seen a repetition of the behavior I was seeing yesterday…).
Thank you for your comments – I’ll keep them in mind if I experience any further problems with the debugger…
Regards,
Steve -
Hello Steven,
We are happy to hear that the problem sorted out, however based on what you are telling us it may be possible that there is a bug in the e2 Studio project upgrade plugin in the latest e2 Studio versions.
To help out other potential users, we would like to forward this to the Renesas e2 Studio team to have them fix this, in case it turns out it is an issue indeed.
May we ask you to upload your original 6.0 project on our site so we can use it to reproduce and address the problems you have encountered?
Please open the original project in e2 Studio 6.0, remove potential sensitive data, leaving the default edid eeprom content sending on uart, then from the File menu choose Export → Archive File to obtain a ZIP file with all relevant e2 Studio project files. Finally, please send us that file so we can analyze it.